

The past week saw yet another Federal Reserve rate hike with the markets, on the whole, being indifferent to the fact that rates are rising (and will continue to rise). The 2-Year U.S. T-Bill rate, more sensitive to moves in the Fed Funds rate than long rates, hit a cycle high at 2.84% on Tuesday. We know that the market cannot hold up forever with Fed rate hikes on a steady upward path. But for the moment, risk assets continue to hold on.
The key macro news was the release of the Fed’s preferred measure of inflation, the Personal Consumption Expenditures index (PCE). The August reading came in at 2.2% y/y, in line with expectations. While the rate of change on the PCE is near the highest levels since 2011, Fed Chair Powell reaffirmed the one rate hike per quarter schedule. Until inflation gets out of control (the Fed likes to get behind the curve, apparently), the FOMC will continue to assess the impact of each rate hike over the subsequent three months. We also got the consumer confidence numbers this past week. The Conference Board Consumer Confidence index jumped to 138.4 in September from 134.7 the prior month. The last time consumer confidence was this euphoric was….well in 2000 at the Tech Bubble peak. University of Michigan Sentiment slipped modestly to 100.1 in September from 100.8 the prior month. This measure of consumer sentiment, while near the high for this economic expansion, is still below the level seen in 2000, around 110.0. Interestingly, this euphoria played out in the markets as individual investors drew down cash balances at brokerage accounts to record lows over the 3rd quarter. The warning signs are present.
Mark Twain is often credited for a version of the saying, “History doesn’t always repeat itself, but it often rhymes,” and regardless of who said it, it’s a phrase we love here because it’s representative of how we analyze markets.
Most investors are aware that the Commodities stocks are the only major equity asset class that has not participated in the U.S. equity market bubble from 2014 until present. Even after rallying off of 2016 lows, Metals & Mining stocks remain -50% to -60% below 2011 highs while Oil Exploration & Production stocks are on average -50% below 2014 highs. This contrasts sharply with bubble sectors, such as Technology +82% above 2014 highs, or Consumer Discretionary, +64% above 2014 highs.
In late 2015/early 2016, with crude oil prices sinking below $30/barrel, fears of bankruptcies rippled through investors’ minds. The question was not IF but WHEN the wave of bankruptcies would start in Oil & Gas, Mining, & other Natural Resource sectors. Portfolio managers and individual investors scrambled to dump their Commodities & Natural Resource stocks after one of the longest bear markets in history. In the market financial jargon, we term this behavior “capitulation”.
There are very few markets in history that have been as extreme as the current one: Buy Technology, win big; buy Resources, lose big. This type of market will not last forever. Benjamin Graham famously said, “In the short–run, the market is a voting machine, but in the long-run it is a weighing machine”. Indeed, while the market is voting for FANG stocks in the short-run, we firmly believe, like Ben Graham, that in the longrun valuations are what matter. And over 200+ years of stock market history confirms that markets inevitably revert back to the mean. This time is not different. No matter what the current narrative recited by Wall Street folks.
The next section outlines how we analyze the commodity space today, in 2018. The following two sections demonstrate graphically the opportunity for investors in commodities today. The fourth section below explains our investment approach for taking advantage of the opportunity present in Natural Resources stocks.
Our Argument For Investing In Commodities Today
Our motivation for investing in Natural Resource stocks today revolves essentially around three arguments:
1. Energy/Basic Materials stocks are the traditional end-of-cycle winners in a stock market cycle.
2. Commodities and Natural Resource stocks allow you to hedge your investments against inflation.
3. Natural Resource stocks offer, by far, the most attractive valuations among all equity classes.
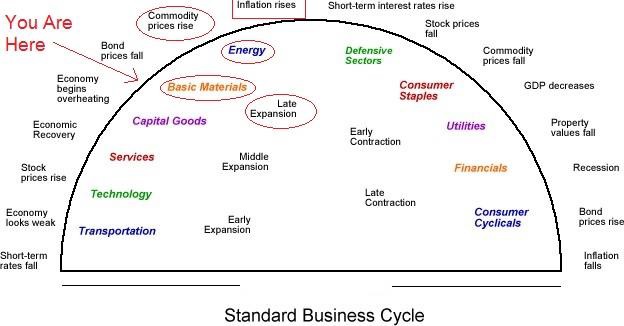
On our first point, stock market cycles never play out in exactly the same manner over time, as evoked in our opening Mark Twain quote. However sector rotation does tend to follow the same patterns, as all economic cycles run from low inflation / low interest rates early in the cycle to high inflation / high interest rates at the end of the cycle. After nine years of bull market and economic expansion, we believe that the end of the cycle is not far off. Early cycle performers, including Tech and Retail, will begin to underperform, giving way to traditional late cycle out-performers.
The chart below demonstrates the typical business cycle.
Our second argument is based on the reality that central bank money printing and holding interest rates below the market equilibrium level for several years will have dire consequences for inflation. Inflation has been “masked” within the economy as most of the excess liquidity provided by the Federal Reserve found its way into the stock market (the only viable investment with bonds offering negative real rates for much of this cycle). Indeed, inflation has been present if your inflation barometer is the Dow Jones Industrial Average.
Unfortunately, only 30% of American households have investments in the stock market. The Dow Jones Industrial Average inflation has not been felt by most of the population. As the business cycle progresses and higher short-term interest rates begin to bite, money leaving Wall Street will spillover to Main Street. With the economy now at full employment (unemployment rate at 3.9%, wage gains at +2.9% y/y) and Trump fiscal stimulus kicking in, the spillover of liquidity provided by the Federal Reserve since 2009 into the economy will be the straw that breaks the back of this inflation camel. We do not believe that the Federal Reserve can absorb the excess liquidity in the economy quickly enough (via accelerated rate hikes) to check inflation. Herein lies the attractiveness of small/mid-cap Natural Resources companies as a hedge against this very real inflation risk that the market is not yet discounting. Investors have abandoned assets which protect against inflation. We believe that this will prove to be a mistake as inflation will become a significant concern for markets in the near future.
Our final point is simply the valuation argument. Little capital has moved into Natural Resource stocks this economic cycle relative to the index stocks, as illustrated by the first figure below. Distorted interest rates, money printing, and low inflation in the real economy have all contributed to major divergence in valuations among different equity classes. Investor interest in Natural Resource stocks is at record lows.

The next figure below is revealing of the valuation divergences with the S&P 500. The Shiller P/E (or cyclically adjusted price-to-earnings ratio, or CAPE) is a useful standard of comparison for valuations. It is defined as price divided by the average of ten years of earnings, adjusted for inflation. The Shiller P/E is used to assess likely future returns from equities over timescales of 10 to 20 years, with higher than average CAPE values implying lower than average long-term annual average returns. What we find striking is the spread between traditional P/E and Shiller P/E. Today Energy is trading -7.3x BELOW its regular P/E. By comparison, Technology is 5.1x ABOVE its regular P/E and the entire S&P 500 is 8.1x ABOVE its regular P/E. If the Shiller P/E has any merit, Energy is offering the most attractive likely future returns.

This figure is just to illustrate the divergences within the stocks in the S&P 500. We firmly believe the real attractiveness in valuations is not in energy and materials index stocks, bid up by the index investing craze, but rather in the small and mid-cap Natural Resources companies neglected over this recent stock market cycle.
Growth vs. Value investing styles go into and out of favor. Value has been out of favor for a long time this cycle, but value will once again be looked upon as an important metric in stock selection. In sum, our valuation argument is that of a return to the mean trade.
Hard Asset Prices On The Upswing…
Commodity Index prices rallied after the Financial Crisis only to top out in 2011, stagnate for a couple years, before collapsing in 2014. Numerous factors weighed on commodity prices, notably the cycle bottom on the Dollar Index in 2011 and subsequent +42% rally in the Greenback. Screwy monetary policies, which distorted global interest rates, and anticipations of a faster-moving Federal Reserve relative to foreign central banks, explain much of the weakness in commodity prices during this economic expansion.
Hard asset prices to a large extent, and Natural Resource company stocks to a lesser extent, are weakly correlated with risk assets, as represented by the S&P 500. As such, astute asset allocators seek to over/under-weight broad market equities or commodities according to where we are in the cycle. Our chart below shows the Gold Sachs Commodity Index relative to the S&P 500. We put on a 5-Year rolling moving average, the approximate duration of past commodity cycles. Setting the +50% and -50% as the upper and lower bounds, we get an excellent vision of the relative commodity/stock cycle.
When the curve is above +50%, stocks are relative cheap and commodities are relatively expensive. Imagine buying the S&P 500 on the spikes higher in the curve below: 1981, 1991, 2003, 2009.
When the curve is below -50%, commodities are relative cheap and stocks are relatively expensive. Imagine buying Commodities on the spikes down in the curve below: 1986, 1998, or….2016.
Readers should get the message.

…Yet Commodity Stocks Slow To React
While Commodity price have likely bottomed relative to the S&P 500, investors have been slow to rotate out of Tech and Retail stocks and into Resource stocks. The next chart shows the S&P North America Natural Resource Sector (commodity stocks) relative to the S&P 500. Friends, commodity stocks, on a relative basis, are AT CYCLE LOWS. And this despite the start of the new Super Cycle in hard asset prices shown above.
It is interesting to note that last cycle, when the S&P 500 topped out in October 2007, commodity stocks continued to rally until July 2008, at which point the S&P 500 had already fallen -22%! On a relative basis, commodity stocks held on until 2011, when the commodity bear market began.

How We Are Investing In Natural Resources
We firmly believe that the single most attractive investment opportunity today is in Natural Resources. We would go so far as to say that it is a generational buying opportunity, in light of S&P Natural Resources / S&P 500 chart above. With such a conviction, we have created a dedicated Natural Resources portfolio to help investors best take advantage of this investment theme. Index investing won’t cut the mustard in Natural Resource investing, as the best companies are sparsely present in the indexes. Stock picking, a long-forgotten investment approach, is needed today to invest in Natural Resources.
We have the quantitative tools to find and remain in the right companies. The WMA Fundamental Allocation rankings screens over 4,000 listed companies based on 12 important metrics (see appendix 1 below). Our models ensure that we are investing in the Natural Resource companies with improving fundamentals and lowest risk businesses. For example, among our 12 company metrics is our Financial Situation score which compares four important ratios (Debt/Equity; EBITDA/Interest Expense; Current Ratio; Cash Flow/Total Liabilities) across all companies. We avoid companies with dangerous debt levels. We maintain a dynamic Watch List of potential companies for investment, updated weekly with the latest company fundamental data.
In addition, we run a daily Trading Model on our favorite Natural Resource companies in order to better manage risk (see appendix 2 below). With the volatility in Natural Resource stocks, constant monitoring is necessary. Although we are targeting the long-term, many investors assess their portfolios on a monthly basis. The Trading Model assures that, if price divergence from what we see in the fundamentals, we can react quickly to avoid holding any stocks in down-trends.
Moreover we offer the right management for a Natural Resources portfolio. In addition to the quantitative portfolio management tools offered by WMA, our Natural Resources portfolio benefits from the 45-years of industry expertise of Bill Cara, senior advisor to the fund, and Ken Ford, client relations advisor, with over two decades of investment experience.
Conclusion
Being lonely with your investment decisions takes courage. Joining the crowd is reassuring and easy. However the crowd does not earn outsized investment returns over the long haul. What should investors be afraid of today? What decision takes more courage, at the risk of under-performing in the short-run? Buying inexpensive oil or mining stock near cycle lows? Or buying a fully-valued (and them some) FANG technology stocks at cycle highs?
We don’t have a crystal ball, but today’s market environment seems to rhyme with 1929, the 1970s, and 1990/2000. These were all excellent times to rotate from equities into commodities. Even if readers wish to hold on to their Tech stocks, we encourage you complement your portfolio by diversifying into Natural Resource stocks. Low correlations between Natural Resource companies and the broad equity market will help your portfolio survive when inflation returns in force and/or the over-bought equities index products revert down to their means.
As always, we are delighted to have your feed-back or discuss further. Contact us and we will reach out to you!
Appendix 1: Twelve WMA Fundamental Metrics
Below we show the rankings of Occidental Petroleum (OXY), an oil exploration & production company and current Natural Resource portfolio holding, and one of its competitor SM Energy (SM) as an example of our company ranking methodology. Scores range from 0 to 100 with the break point at 50 (similar to a diffusion index) We prefer Occidental over SM as a Growth company due to the higher year-to-year EPS and Sales growth (70.2 vs 55.9, looking at the sector-level comparisons) and the stronger revisions (60.4 and 69.7 vs. 57.2 and 51.1). As valuation is important for us (even for selecting a growth company), we look at the PEG (price/earnings-to-growth rate) in making our selections. In this case, with a PEG ratio in the top 94th percentile among energy companies, we can be assured that Occidental is offering growth at a reasonable price. In addition, the valuation numbers for Occidental are relatively more attractive (Valuation, PER, MV/EBITDA and Book Value) and the balance sheet is relatively more solid (Financials above the key 50 level at 55.5).

Appendix 2: Watch List / Trading Model
Our daily price trend analysis gives us an excellent vision of what is happening with our Watch List companies on the exchanges. Buy alerts, Sell alerts, break-outs, RSI signals and price trend are all captured by our Model. We do not remain dogmatic if price does not cooperate with our fundamental analysis. Feel free to contact us to learn about how to read our Models.
