

In last week’s article, “It’s A Stocks Picker’s Market. Here’s How We Are Picking Them”, we outlined our use of our fundamental ranking methodology in building a high-quality portfolio. In that article, we focused on our system of company fundamentals that we use to calculate composite “F-scores” for Growth, Value and Yield that we then do a relative ranking for some 5,000 companies that trade in US markets.
To reiterate, our “F-scores” are based on the following weekly updates of data for company:
• Growth
• EPS Revisions
• Revenue Revisions
• Price/Earning/Growth (PEG)
• Valuations
• P/E
• P/E spreads vs. historical mean P/E
• P/Book Value spreads vs. historical mean P/BV
• Market Value / EBITDA
• Yield
• Profitability
• Financial Situation
• Consensus Analyst Recommendation
To deem a company’s stock a “Growth” stock, we focus on the first four scores (although all F-scores enter into the calculation). High growth is important, but so is growth at a reasonable price (PEG). For a company to be qualified as “Value”, we focus on the next five scores (not disregarding things like EPS and Revenue revisions). Just comparing forward consensus P/Es is not a very robust approach. Finally, a Yield stock will have high Yield, Profitability, and Financial scores. For a company to maintain the high yield, it must have profits. Similarly, investors buying a stock for the current income want a stable cash cow, hence the attention to Financials.
We bring in data from the most reliable financial data providers (Bloomberg, Thomson Reuters), including the valuable consensus forecast data, to create a 0 to 100 ranking for all companies in each of our thirteen categories (100 being top-of-class). A score of 50 represents either the median of all companies, or the break-even point for some measures (for example, 0% growth, 0% profitability). Our database contains over 5,000 listed companies (both U.S. and foreign companies accessible on U.S. exchanges via dollardenominated ADRs). In addition, we calculate the percentile ranking so that investors can see the ordinal ranks for companies under consideration.
In that article we used our system to select a few companies based on current data.
We also noted in the conclusion that “One investment strategy will never out-perform forever.” As we know, market conditions change over time and investing approaches go in and out of favor. For many years, Passive investing has been much more popular than Active investing, and as active managers we hope that will change. It will if there is enough evidence to justify it. Also, Growth has in recent years been more popular among most investors than Value or Yield; but that too will change we believe.
This weekend, we will review the variations in F-score data for the Dow 30 companies to give some insights in how this system is working out.
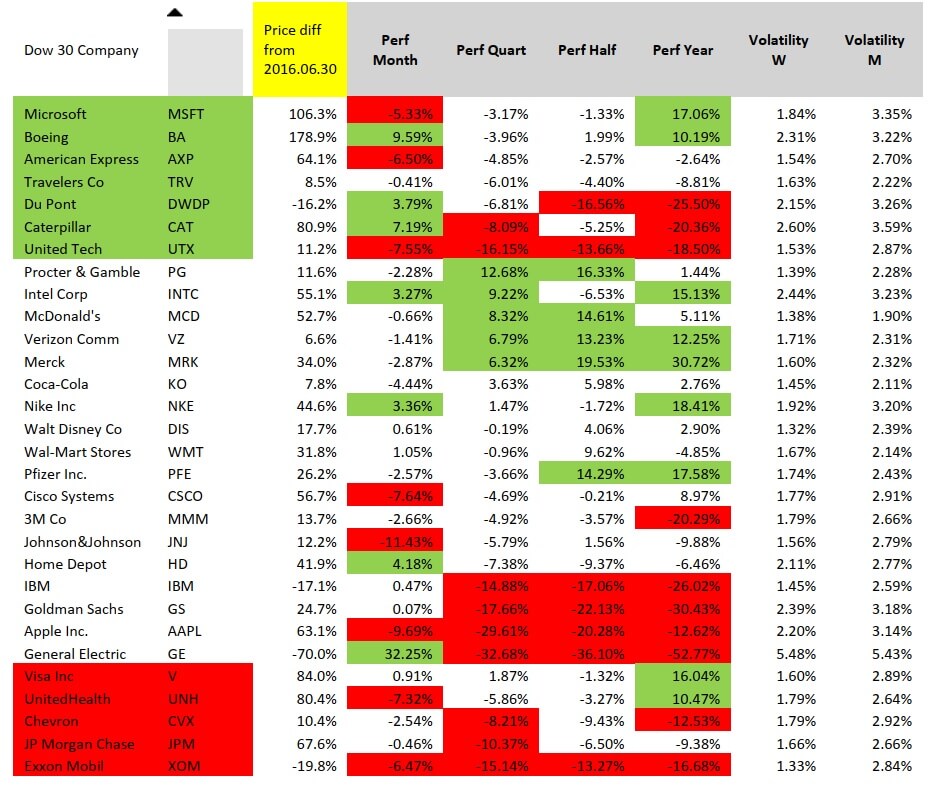
Here is the raw data. We compared current data and stock prices to the same data at the end of 2Q2016, which is two-and-a-half years ago. We also noted the change in stock price between the end of 2Q2016 and this week and sorted the list by the biggest price changes.
Over 30 months, the biggest winners have been BA +178.9% and MSFT +106.3%. While most stocks earned satisfactory returns over this period, four of the 30 were losers. GE -70.0% was down the most, followed by XOM -19.8%, IBM-17.1% and DWDP -16.2% (noting the ticker change from DD after a large merger).

It could be that Dow 30 stock price-performance has changed considerably over the past year, so we created a table to show these price-performance results. This data comes from FinViz.com.
We are looking for how the companies with substantial improvements in Growth scores (in green) fared vs the same for those companies that had worsening Growth scores (in red).
From the table below, we could not come to any conclusion that 30-month improving or worsening F-scores had any discernible impact on price-performance this past year.
Due to time issues this weekend, we cannot go more in-depth now with this analysis. However, we’ll get back to the theme of changing F-scores and stock price performance in latter missives.
One limitation to our quick glance at Dow company fundamentals is that we have tweaked our rankings over the past couple years as we gain more insights on how to measure company fundamentals (yes, even we are still learning how to best analyse different cross-sections of the market!). Moreover, we have constantly been improving our data (now using Thomson Reuters consensus estimates for many key measures) and our statistical analysis (how we crush the numbers to create the rankings). To produce robust results in a study of changing fundamental score and stock price performance, we will need to take a longer look-back period with our now highly-evolved methodology. We know that in the short-run, sentiment drives stock prices, while in
the long-run, company fundamentals will dominate.
In the meantime, readers can now track each company’s F-score variations on our Fundamental Allocation Model.

The delta (Δ) G column – change in Growth score – gives an up-arrow if the week/week Composite Growth Score made a positive 1 standard deviation move. Similarly, a down-arrow indicates a negative 1 standard deviation score change. For companies with little change in F-scores, the box remains blank. In sum, based on our Growth criteria (Sales, EPS year-on-year growth estimates, PEG, or EPS/Sales revisions) if any or all of these variables change sharply for a company, we want to know right away. The weekly F-scores variation alerts applies also for our Valuation score (Δ V) and our Yield score (Δ Y).
Finally, we pull out the top F-score variations each week among the whole universe of 5,000 companies (Company Upgrades/Downgrades). Again, getting a “fundamental buy/sell alert” often has greater long-term significance than a price buy/sell alert. Readers looking for investment ideas can also check in each Monday to see which companies received a fundamental upgrade in our rankings.
